Explore
Featured
Recent
Articles
Topics
Login
Upload
Featured
Recent
Articles
Topics
Login
Upload
Search Results for 'amp figure'
amp figure published presentations and documents on DocSlides.
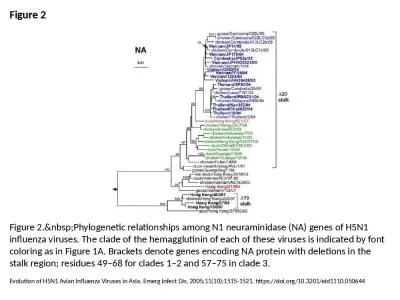
Figure 2 Figure 2. Phylogenetic relationships among N1 neuraminidase (NA) genes of H5N1 in
by martin
Evolution of H5N1 Avian Influenza Viruses in Asia....
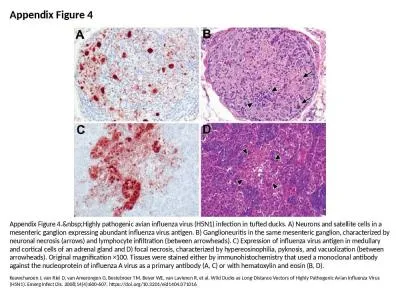
Appendix Figure 4 Appendix Figure 4. Highly pathogenic avian influenza virus (H5N1) infect
by elizabeth
Keawcharoen J, van Riel D, van Amerongen G, Besteb...
Figure 1 Figure 1. Phylogenetic tree of hemagglutinin (HA) segments from 36 avian influenz
by audrey
Salzberg SL, Kingsford C, Cattoli G, Spiro DJ, Jan...
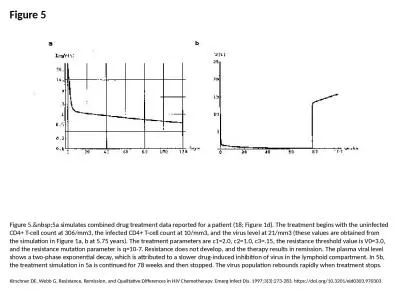
Figure 5 Figure 5. 5a simulates combined drug treatment data reported for a patient (18; F
by ximena
Kirschner DE, Webb G. Resistance, Remission, and Q...
Figure 2 Figure 2. Seroconversion in sentinel specific-pathogen-free white leghorns after
by taylor
Marcus PI, Girshick T, van der Heide L, Sekellick ...
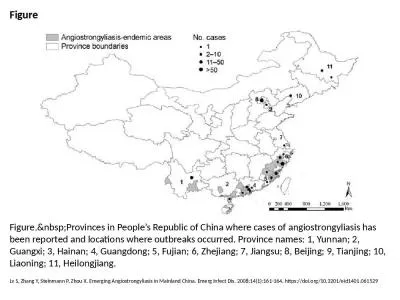
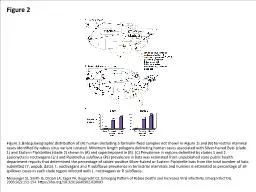
Figure Figure. Provinces in People’s Republic of China where cases of angiostrongyliasis
by ani
Lv S, Zhang Y, Steinmann P, Zhou X. Emerging Angio...
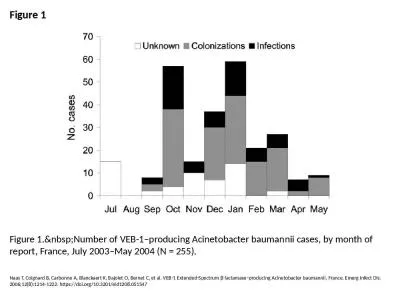
Figure 1 Figure 1. Number of VEB-1–producing Acinetobacter baumannii cases, by month of
by zoe
Naas T, Coignard B, Carbonne A, Blanckaert K, Bajo...
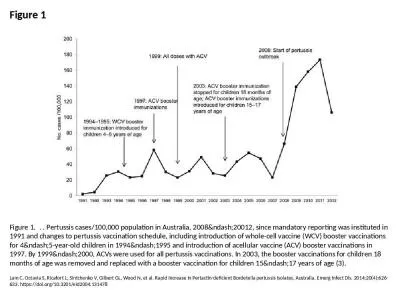
Figure 1 Figure 1. . . Pertussis cases/100,000 population in Australia, 2008–20012, sinc
by madison
Lam C, Octavia S, Ricafort L, Sintchenko V, Gilber...
Figure 7
by alida-meadow
Fractional . Factorials. This first example (C=AB...
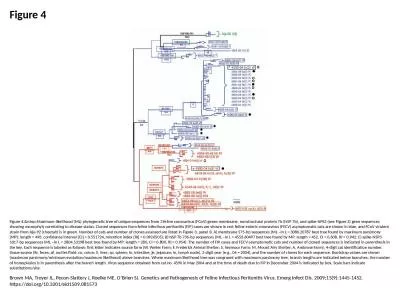
Figure 4 Figure 4. Maximum-likelihood (ML) phylogenetic tree of unique sequences from 3 fe
by elise
Brown MA, Troyer JL, Pecon-Slattery J, Roelke ME, ...
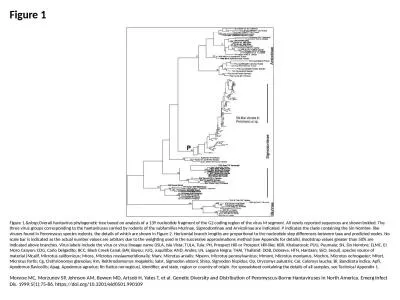
Figure 1 Figure 1. Overall hantavirus phylogenetic tree based on analysis of a 139 nucleot
by emmy
Monroe MC, Morzunov SP, Johnson AM, Bowen MD, Arts...
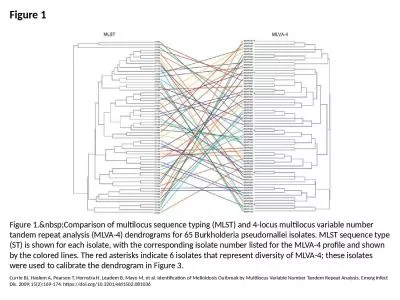
Figure 1 Figure 1. Comparison of multilocus sequence typing (MLST) and 4-locus multilocus
by byrne
Currie BJ, Haslem A, Pearson T, Hornstra H, Leadem...
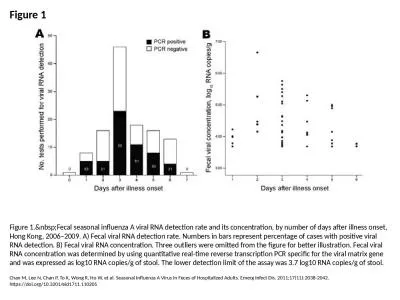
Figure 1 Figure 1. Fecal seasonal influenza A viral RNA detection rate and its concentrati
by bery
Chan M, Lee N, Chan P, To K, Wong R, Ho W, et al. ...
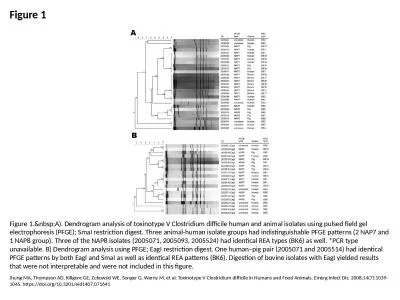
Figure 1 Figure 1. A). Dendrogram analysis of toxinotype V Clostridium difficile human and
by finley
Jhung MA, Thompson AD, Killgore GE, Zukowski WE, S...
Figure 2 Figure 2. Geographic distribution of (A) human (including 5 formalin-fixed sample
by naomi
Messenger SL, Smith JS, Orciari LA, Yager PA, Rupp...
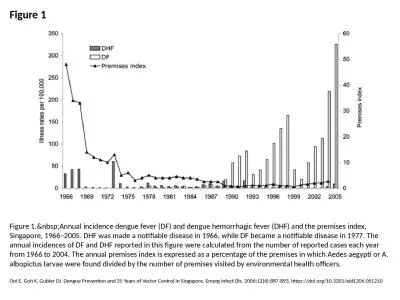
Figure 1 Figure 1. Annual incidence dengue fever (DF) and dengue hemorrhagic fever (DHF) a
by thomas
Ooi E, Goh K, Gubler DJ. Dengue Prevention and 35 ...
Figure Figure. Acute form of African swine fever in wild boars. A) Petechial and larger ec
by dorothy
Rahimi P, Sohrabi A, Ashrafihelan J, Edalat R, Ala...
Figure 1Type KA4 Relay without case Front View
by scarlett
41-923.4M 41-923.4M Figure 2.Internal Schematic of...
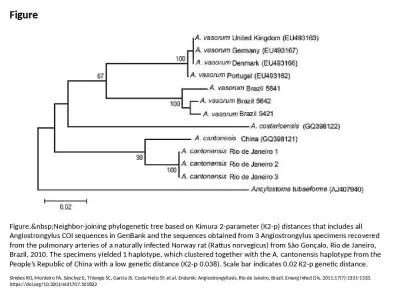
Figure Figure. Neighbor-joining phylogenetic tree based on Kimura 2-parameter (K2-p) dista
by susan2
Simões RO, Monteiro FA, Sánchez E, Thiengo SC, G...
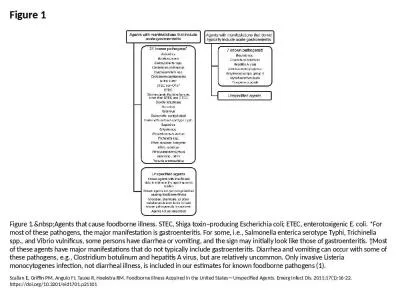
Figure 1 Figure 1. Agents that cause foodborne illness. STEC, Shiga toxin–producing Esch
by finley
Scallan E, Griffin PM, Angulo FJ, Tauxe R, Hoekstr...
Symbolism Figure w/ Cardboard
by debby-jeon
Judith Kindler. Notice the direction of the birds...
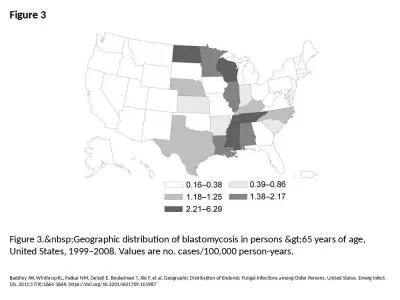
Figure 3 Figure 3. Geographic distribution of blastomycosis in persons >65 years of
by pamela
Baddley JW, Winthrop KL, Patkar NM, Delzell E, Beu...
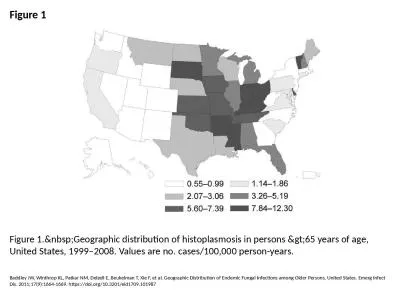
Figure 1 Figure 1. Geographic distribution of histoplasmosis in persons >65 years o
by davies
Baddley JW, Winthrop KL, Patkar NM, Delzell E, Beu...
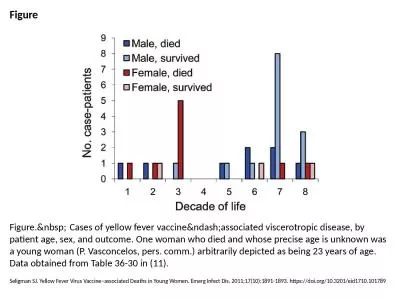
Figure Figure. Cases of yellow fever vaccine–associated viscerotropic disease,
by brianna
Seligman SJ. Yellow Fever Virus Vaccine–associat...
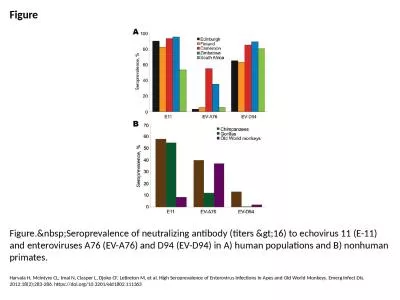
Figure Figure. Seroprevalence of neutralizing antibody (titers >16) to echovirus 11
by alis
Harvala H, McIntyre CL, Imai N, Clasper L, Djoko C...
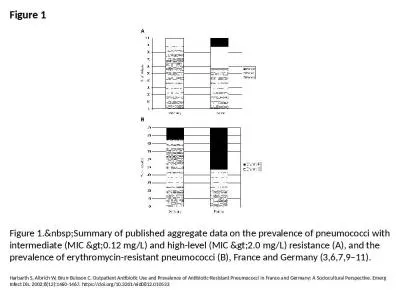
Figure 1 Figure 1. Summary of published aggregate data on the prevalence of pneumococci wi
by beckham342
Harbarth S, Albrich W, Brun-Buisson C. Outpatient ...
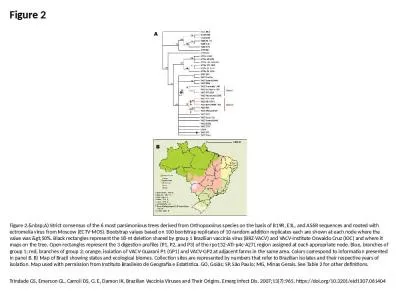
Figure 2 Figure 2. A) Strict consensus of the 6 most parsimonious trees derived from Ortho
by naomi
Trindade GS, Emerson GL, Carroll DS, G. E, Damon I...
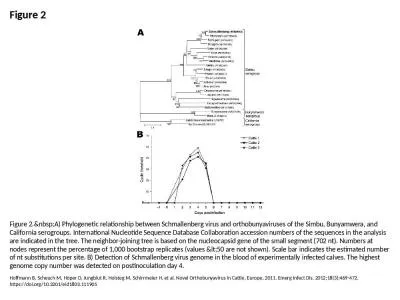
Figure 2 Figure 2. A) Phylogenetic relationship between Schmallenberg virus and orthobunya
by grace3
Hoffmann B, Scheuch M, Höper D, Jungblut R, Holst...
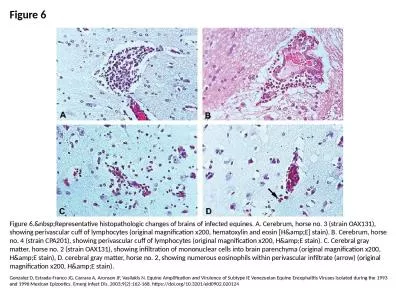
Figure 6 Figure 6. Representative histopathologic changes of brains of infected equines. A
by ida
Gonzalez D, Estrada-Franco JG, Carrara A, Aronson ...
Habits, Depression, & Fixes
by teresa
Depression & Decision Making . Spring 2017 . C...
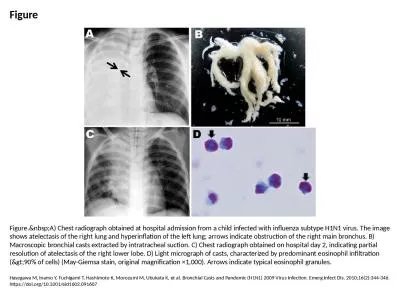
Figure Figure. A) Chest radiograph obtained at hospital admission from a child infected wi
by ceila
Hasegawa M, Inamo Y, Fuchigami T, Hashimoto K, Mor...
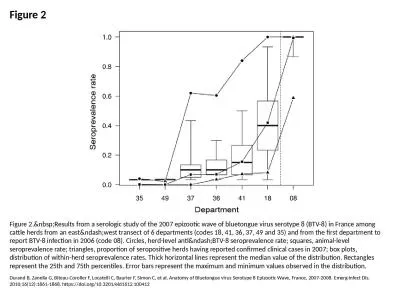
Figure 2 Figure 2. Results from a serologic study of the 2007 epizootic wave of bluetongue
by bety
Durand B, Zanella G, Biteau-Coroller F, Locatelli ...
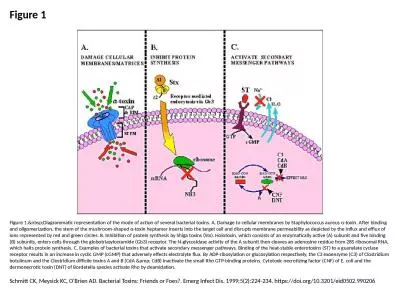
Figure 1 Figure 1. Diagrammatic representation of the mode of action of several bacterial
by isla
Schmitt CK, Meysick KC, O'Brien AD. Bacterial Toxi...
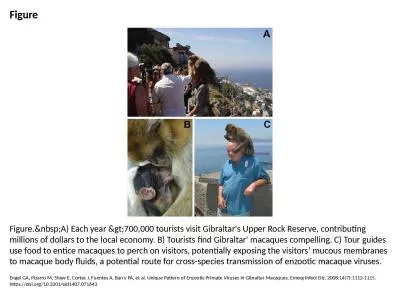
Figure Figure. A) Each year >700,000 tourists visit Gibraltar's Upper Rock Reserve,
by joyce
Engel GA, Pizarro M, Shaw E, Cortes J, Fuentes A, ...
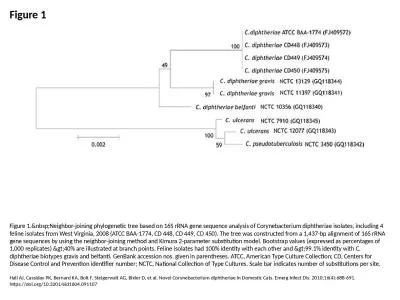
Figure 1 Figure 1. Neighbor-joining phylogenetic tree based on 16S rRNA gene sequence anal
by faith
Hall AJ, Cassiday PK, Bernard KA, Bolt F, Steigerw...
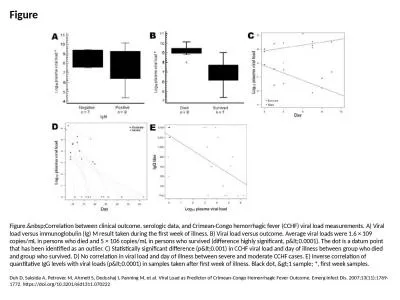
Figure Figure. Correlation between clinical outcome, serologic data, and Crimean-Congo hem
by jones
Duh D, Saksida A, Petrovec M, Ahmeti S, Dedushaj I...
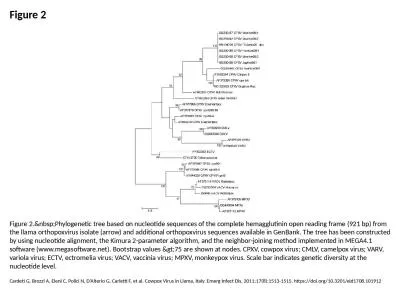
Figure 2 Figure 2. Phylogenetic tree based on nucleotide sequences of the complete hemaggl
by everly
Cardeti G, Brozzi A, Eleni C, Polici N, D’Alteri...
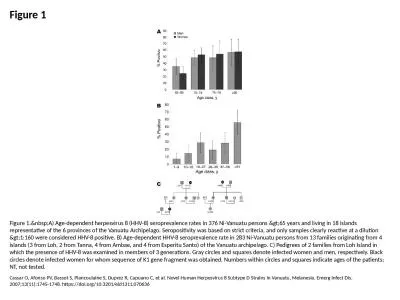
Figure 1 Figure 1. A) Age-dependent herpesvirus 8 (HHV-8) seroprevalence rates in 376 Ni-V
by lucy
Cassar O, Afonso PV, Bassot S, Plancoulaine S, Dup...
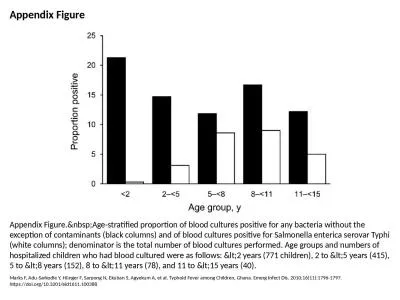
Appendix Figure Appendix Figure. Age-stratified proportion of blood cultures positive for
by quinn
Marks F, Adu-Sarkodie Y, Hünger F, Sarpong N, Eku...
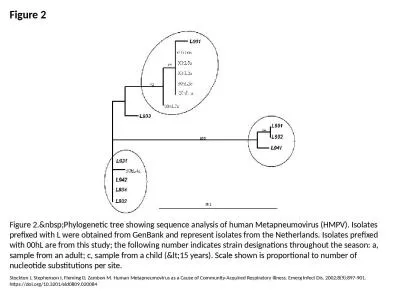
Figure 2 Figure 2. Phylogenetic tree showing sequence analysis of human Metapneumovirus (H
by taylor
Stockton J, Stephenson I, Fleming D, Zambon M. Hum...
Load More...